Why Optimization?

Unit 5 ends with a return to a realistic context. To optimize something means to find the best way to do it. “Best” or “optimum” may mean the quickest, the cheapest, the most profitable, or the easiest way to do something.

For example, you may be asked to build a box of a given volume with the least, and therefore cheapest, amount of material. Thus, these are really problems where you need to find the maximum or minimum of the function that models the situation.  There are applications to engineering, finance, science, medicen, and economics among others.

The most difficult part of these problems is often writing the equation to be optimized; not the calculus involved. Once you have the model, finding the extreme value is easy.

The last part of this unit extends the ideas of this unit to implicit relations, those whose graph may not be a function. These too, increase, decrease, and have extreme values. The same techniques help you to find them.  


Course and Exam Description Unit 5 Sections 11 and 12


A note for teachers: You are not behind scheduel. Please remember that I am posing this series ahead, probably well ahead, of where you are. This is so that they will be here when you get here.


Why L’Hospital’s Rule?

Why L’Hospital’s Rule?

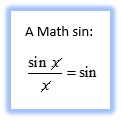
We are now at the point where we can look at a special technique for finding some limits. Graph on your calculator y = sin(x) and y = x near the origin. Zoom in a little bit. The line is tangent to sin(x) at the origin and their values are almost the same. Look at the two graphs near the origin and see if you can guess the limit of their ratio at the origin:   \displaystyle \underset{{x\to 0}}{\mathop{{\lim }}}\,\frac{{\sin \left( x \right)}}{x}?.

In this example, if you substitute zero into the expression you get zero divided by zero and there is no way to divide out the zero in the dominator as you could with rational expressions.  

This kind of thing is called an indeterminate form. The limit of an indeterminate form may have a value, but in its current form you cannot determine what it is. When you studied limits, you were often able to factor and divide out the denominator and find the limit for what was left. With \displaystyle \frac{{\sin \left( x \right)}}{x} you can’t do that.  

But by replacing the expressions with their local linear approximations, the offending factor will divide out leaving you with the ratio of the derivatives (slopes). This limit may be easier to find.

The technique is called L’Hospital’s Rule, after Guillaume de l’Hospital (1661 – 1704) whose idea it wasn’t! He sort of “borrowed’ it from Johann Bernoulli (1667 – 1784).

L’Hospital’s Rule gives you a way of finding limits of indeterminate forms. You will look at indeterminate forms of the types \displaystyle \tfrac{0}{0} and \displaystyle \tfrac{\infty }{\infty }. The technique may be expanded to other indeterminate forms like  \displaystyle {{1}^{\infty }},\ 0\cdot \infty ,\ \infty -\infty ,\ {{0}^{0}},\text{and }{{\infty }^{0}}, which are not tested on the AP Calculus exams.

Like other “rules” in math, L’Hospital’s Rule is really a theorem. Before you use it, you must check that the hypotheses are true. And on the AP Calculus exams you must show in writing that you have checked.


Course and Exam Description Unit 4 Topic 7

Why Approximate?

In real life everything is messier than in calculus. You are used to getting “exact” answers in mathematics. You will soon find situations where the only way to get an answer is to approximate it.

Over the year, you will learn several techniques for approximating. In college, you may take a course called Numerical Approximations, learning approximation techniques. If you use calculators or computers to find a solution; these are often approximations requiring a lot of arithmetic.

Graphing calculators approximate difference quotients using the symmetric difference quotient with a very small value of \displaystyle \Delta x.

Remember when you zoomed in on a function and found that close-up it looked like a line. Over small distances near the point of tangency the tangent line has approximately the same y-coordinates as the function. This is called local linearity – over very short intervals most functions appear linear.

One way to approximate a function’s value is to travel along the tangent line from a point you know to a nearby point that you don’t know. You do this by writing the equation of the tangent line at the point you know and then moving a short distance along it. The line’s y-coordinate is close to the function’s and may be used to approximate it. Soon, when you study differential equations, you will use this idea in a slightly different way. When you get to integration and later infinite series you will learn more approximation techniques.

With any approximation, it is useful to know how close the approximation is to the value you are approximating. The first shot at this is to look at the concavity near where you are working. From the concavity you can tell if the tangent line lies above or below the curve. With that, you can determine whether you have an overestimate or an underestimate.

Now, let’s see how close we can get.


Course and Exam Description Unit 4 Section 4.6, Unit 10 Sections 10.2 and 10.10

Why Related Rates?

There are situations where a dependent variable is dependent on more than one independent variable. For example, the volume of a rectangular box depends on its length, width, and height, \displaystyle V=lwh.

Think of a box shaped balloon being blown up.  The volume and all three dimensions are all changing at the same time. Their rates of change are related to each other.

Since rates of change are derivatives, all the derivatives are related. Given several of the rates, you can find the others.

In these problems you use implicit differentiation to find the relationship between the variables and their derivatives. That means that you differentiate with respect to time. And time is usually not one of the variables in the equations. \displaystyle V=lwh – see no t anywhere. Really, the length, width and height are all functions of time; you just don’t see the t.

Sometimes the substitutions required to work your way through these problems are the tricky part. So, be careful with your algebra.


Course and Exam Description Unit 4 sections 4.3 to 4.5.

Why Linear Motion?

Now that you know how to compute derivatives it is time to use them. The next few topics and my next few posts will discuss some of the applications of derivatives, and some of the things you can use them for.

The first is linear motion or motion along a straight line.

Derivatives give the rate of change of something that is changing. Linear motion problems concern the change in the position of something moving in a straight line. It may be someone riding a bike, driving a car, swimming, or walking or just a “particle” moving on a number line.

The function gives the position of whatever is moving as a function of time. This position is the distance from a known point often the origin. The time is the time the object is at the point. The units are distance units like feet, meters, or miles.

The derivative position is velocity, the rate of change of position with respect to time.  Velocity is a vector; it has both magnitude and direction. While the derivative appears to be just a number its sign counts: a positive velocity indicates movement to the right or up, and negative to the left or down. Units are things like miles per hour, meters per second, etc.

The absolute value of velocity is the speed which has the same units as velocity but no direction.

The second derivative of position is acceleration. This is the rate of change of velocity. Acceleration is also a vector whose sign indicates how the velocity is changing (increasing or decreasing). The units are feet per minute per minute or meters per second per second. Units are often given as meters per second squared (m/s2) which is correct but meters per second per second helps you understand that the velocity in meters per second is changing so much per second.   

Of these four, velocity may be the most useful. You will learn how to use the velocity (the first derivative) and its graph to determine how the particle moves over intervals of time: when it is moving left or right, when it stops, when it changes direction, whether it is speeding up or slowing down, how far the object moves, and so on. You can also find the position from the velocity if you also know the starting position.

You will work with equations and with graphs without equations. Reading the graphs of velocity and acceleration is an important skill to learn.

The reasoning used in linear motion problems is the same as in other applications. What you do is the same; what it means depends on the context.

Not to scare anyone, but linear motion problems appear as one of the six free-response questions on the AP Calculus exams almost every year as well as in several the multiple-choice questions.

So, let’s get moving!


Course and Exam Description Unit 4 Sections 4.1 and 4.2

Graph Analysis Questions (Type 3)

AP  Questions Type 3: Graph Analysis

The long name is “Here’s the graph of the derivative, tell me things about the function.”

Students are given either the equation of the derivative of a function or a graph identified as the derivative of a function with no equation is given. It is not expected that students will write the equation of the function from the graph (although this may be possible); rather, students are expected to determine key features of the function directly from the graph of the derivative. They may be asked for the location of extreme values, intervals where the function is increasing or decreasing, concavity, etc. They may be asked for function values at points. They will be asked to justify their conclusions.

The graph may be given in context and students will be asked about that context. The graph may be identified as the velocity of a moving object and questions will be asked about the motion. See Linear Motion Problems (Type 2)

Less often the function’s graph may be given, and students will be asked about its derivatives.

What students should be able to do:

  • Read information about the function from the graph of the derivative. This may be approached by derivative techniques or by antiderivative techniques.
  • Find and justify where the function is increasing or decreasing.
  • Find and justify extreme values (1st and 2nd derivative tests, Closed interval test a/k/a Candidates’ test).
  • Find and justify points of inflection.
  • Find slopes (second derivatives, acceleration) from the graph.
  • Write an equation of a tangent line.
  • Evaluate Riemann sums from geometry of the graph only. This usually involves familiar shapes such as triangles or semicircles.
  • FTC: Evaluate integral from the area of regions on the graph.
  • FTC: The function, g(x), may be defined by an integral where the given graph is the graph of the integrand, f(t), so students should know that if,

\displaystyle g\left( x \right)=g\left( a \right)+\int_{a}^{x}{{f\left( t \right)dt}}, then  \displaystyle {g}'\left( x \right)=f\left( x \right)  and  \displaystyle {g}''\left( x \right)={f}'\left( x \right).

In this case, students should write \displaystyle {g}'\left( x \right)=f\left( x \right) on their answer paper, so it is clear to the reader that they understand this.

Not only must students be able to identify these things, but they are usually asked to justify their answer and reasoning. See Writing on the AP Exams for more on justifying and explaining answers.

There are numerous ideas and concepts that can be tested with this type of question. The type appears on the multiple-choice exams as well as the free-response. Between multiple-choice and free-response this topic may account for 15% or more of the points available on recent tests. It is very important that students are familiar with all the ins and outs of this situation.

As with other questions, the topics tested come from the entire year’s work, not just a single unit. In my opinion many textbooks do not do a good job with integrating these topics, so be sure to use as many actual AP Exam questions as possible. Study past exams: look them over and see the different things that can be asked.

The Graph Analysis problem may cover topics primarily from primarily from Unit 4, Unit 5, and Unit 8 of the CED 

For previous posts on this subject see October 1517192426 (my most read post), 2012 and January 2528, 2013

Free-response questions:

  • Function given as a graph, questions about its integral (so by FTC the graph is the derivative):  2016 AB 3/BC 3, 2018 AB3
  • Table and graph of function given, questions about related functions: 2017 AB 6,
  • Derivative given as a graph: 2016 AB 3 and 2017 AB 3
  • Information given in a table 2014 AB 5
  • 2021 AB 4 / BC 4
  • 2021 AB 5 (b), (c), (d)
  • 2022 AB3 / BC3 – graph analysis, max/min
  • 2023 AB 4 / BC 4 – graph stem, max/min, concavity, L’Hospital’s Rule

Multiple-choice questions from non-secure exam. Notice the number of questions all from the same year; this is in addition to one free-response question (~25 points on AB and ~23 points on BC out of 108 points total)

  • 2012 AB: 2, 5, 15, 17, 21, 22, 24, 26, 76, 78, 80, 82, 83, 84, 85, 87
  • 2012 BC 3, 11, 12, 15, 12, 18, 21, 76, 78, 80, 81, 84, 88, 89

A good activity on this topic is here. The first pages are the teacher’s copy and solution. Then there are copies for Groups A, B, and C. Divide your class into 3 or 6 or 9 groups and give one copy to each. After they complete their activity have the students compare their results with the other groups.


Revised March 12, 2021, March 18, 2022, June 4, 2023


Linear Motion (Type 2)

AP Questions Type 2: Linear Motion

We continue the discussion of the various type questions on the AP Calculus Exams with linear motion questions.

“A particle (or car, person, or bicycle) moves on a number line ….”

These questions may give the position equation, the velocity equation (most often), or the acceleration equation of something that is moving on the x– or y-axis as a function of time, along with an initial condition. The questions ask for information about the motion of the particle: its direction, when it changes direction, its maximum position in one direction (farthest left or right), its speed, etc.

The particle may be a “particle,” a person, car, a rocket, etc.  Particles don’t really move in this way, so the equation or graph should be considered a model. The question is a versatile way to test a variety of calculus concepts since the position, velocity, or acceleration may be given as an equation, a graph, or a table; be sure to use examples of all three forms during the review.

Many of the concepts related to motion problems are the same as those related to function and graph analysis (Type 3). Stress the similarities and show students how the same concepts go by different names. For example, finding when a particle is “farthest right” is the same as finding when a function reaches its “absolute maximum value.” See my post for Motion Problems: Same Thing, Different Context for a list of these corresponding terms. There is usually one free-response question and three or more multiple-choice questions on this topic.

The positions(t), is a function of time. The relationships are:

  • The velocity is the derivative of the position \displaystyle {s}'\left( t \right)=v\left( t \right).  Velocity has direction (indicated by its sign) and magnitude. Technically, velocity is a vector; the term “vector” will not appear on the AB exam.
  • Speed is the absolute value of velocity; it is a number, not a vector. See my post for Speed.
  • Acceleration is the derivative of velocity and the second derivative of position, \displaystyle {{s}'}'\left( t \right)={v}'\left( t \right)=a\left( t \right) It, too, has direction and magnitude and is a vector.
  • Velocity is the antiderivative of acceleration.
  • Position is the antiderivative of velocity.

What students should be able to do:

  • Understand and use the relationships above.
  • Distinguish between position at some time and the total distance traveled during the time period.
  • The total distance traveled is the definite integral of the speed (absolute value of velocity) \displaystyle \int_{a}^{b}{{\left| {v\left( t \right)} \right|dt}}.
  •  Be sure your students understand the term displacement; it is the net distance traveled or distance between the initial position and the final position. Displacement is the definite integral of the velocity (rate of change): \displaystyle \int_{a}^{b}{{v\left( t \right)dt}}
  • The final position is the initial position plus the displacement (definite integral of the rate of change from xa to x = t): \displaystyle s\left( t \right)=s\left( a \right)+\int_{a}^{t}{{v\left( x \right)dx}} Notice that this is an accumulation function equation (Type 1).
  • Initial value differential equation problems: given the velocity or acceleration with initial condition(s) find the position or velocity. These are easily handled with the accumulation equation in the bullet above but may also be handled as an initial value problem.
  • Find the speed at a given time. Speed is the absolute value of velocity.
  • Find average speed, velocity, or acceleration
  • Determine if the speed is increasing or decreasing.
    • When the velocity and acceleration have the same sign, the speed increases. When they have different signs, the speed decreases.
    • If the velocity graph is moving away from (towards) the t-axis the speed is increasing (decreasing). See the post on Speed.
    • There is also a worksheet on speed here
    • The analytic approach to speed: A Note on Speed
  • Use a difference quotient to approximate the derivative (velocity or acceleration) from a table. Be sure the work shows a quotient.
  • Riemann sum approximations.
  • Units of measure.
  • Interpret meaning of a derivative or a definite integral in context of the problem

Shorter questions on this concept appear in the multiple-choice sections. As always, look over as many questions of this kind from past exams as you can find.

This may be an AB or BC question. The BC topic of motion in a plane, (Type 8: parametric equations and vectors) will be discussed in a later post.

The Linear Motion problem may cover topics primarily from primarily from Unit 4, and also from Unit 3, Unit 5, Unit 6, and Unit 8 (for BC) of the CED

Free-response examples:

  • 2017 AB 5, Equation stem
  • 2009 AB1/BC1, Graph stem: 
  • 2019 AB2 Table stem 
  •  2021 AB 2 Equation stem
  •  2022 AB6 Equation stem – velocity, acceleration, position, max/min
  • 2023 AB 2 Equation stem – velocity (given), change of direction, acceleration, speeding up or slowing down, position, total distance. 

Multiple-choice examples from non-secure exams:

  • 2012 AB 6, 16, 28, 79, 83, 89
  • 2012 BC 2, 89


Updated: March 15, and May 11, 2022, June 4, 2023